


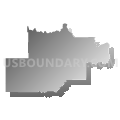
Congressional District 2, Colorado
About
Outline

Summary
| Unique Area Identifier | 118869 |
| Name | Congressional District 2 |
| State | Colorado |
| Area (square miles) | 5,664.03 |
| Land Area (square miles) | 5,604.67 |
| Water Area (square miles) | 59.36 |
| % of Land Area | 98.95 |
| % of Water Area | 1.05 |
| Latitude of the Internal Point | 39.89736340 |
| Longtitude of the Internal Point | -106.17836030 |
| Total Population | 733,805 |
| Total Housing Units | 338,728 |
| Total Households | 282,514 |
| Median Age | 34.7 |
Maps


Graphs
Select a template below for downloading or customizing gragh for Congressional District 2, Colorado


Neighbors
Neighoring 111th Congressional District (by Name) Neighboring 111th Congressional District on the Map
- Congressional District 3, CO
- Congressional District 4, CO
- Congressional District 5, CO
- Congressional District 6, CO
- Congressional District 7, CO
Top 10 Neighboring County (by Population) Neighboring County on the Map
- Jefferson County, CO (534,543)
- Adams County, CO (441,603)
- Larimer County, CO (299,630)
- Boulder County, CO (294,567)
- Weld County, CO (252,825)
- Garfield County, CO (56,389)
- Broomfield County, CO (55,889)
- Eagle County, CO (52,197)
- Summit County, CO (27,994)
- Routt County, CO (23,509)
Top 10 Neighboring County Subdivision (by Population) Neighboring County Subdivision on the Map
- Northeast Jefferson CCD, Jefferson County, CO (450,008)
- West Adams CCD, Adams County, CO (282,940)
- Boulder CCD, Boulder County, CO (115,643)
- Longmont CCD, Boulder County, CO (99,942)
- Loveland CCD, Larimer County, CO (95,583)
- Brighton CCD, Adams County, CO (80,401)
- Lafayette-Louisville CCD, Boulder County, CO (65,784)
- Broomfield CCD, Broomfield County, CO (55,889)
- Erie-Frederick CCD, Weld County, CO (37,786)
- Golden CCD, Jefferson County, CO (35,260)
Top 10 Neighboring Place (by Population) Neighboring Place on the Map
- Thornton city, CO (118,772)
- Arvada city, CO (106,433)
- Westminster city, CO (106,114)
- Boulder city, CO (97,385)
- Longmont city, CO (86,270)
- Broomfield city, CO (55,889)
- Commerce City city, CO (45,913)
- Northglenn city, CO (35,789)
- Lafayette city, CO (24,453)
- Louisville city, CO (18,376)
Top 10 Neighboring Unified School District (by Population) Neighboring Unified School District on the Map
- Jefferson County School District R-1, CO (537,431)
- Boulder Valley School District RE-2, CO (212,161)
- Northglenn-Thornton School District 12, CO (209,792)
- St. Vrain Valley School District RE 1J, CO (151,981)
- Thompson School District R-2J, CO (104,236)
- Brighton School District 27J, CO (77,537)
- Westminster School District 50, CO (70,290)
- Eagle County School District RE 50, CO (44,055)
- Roaring Fork School District RE-1, CO (37,655)
- Adams County School District 14, CO (36,462)
Top 10 Neighboring State Legislative District Lower Chamber (by Population) Neighboring State Legislative District Lower Chamber on the Map
- State House District 48, CO (112,104)
- State House District 31, CO (100,635)
- State House District 32, CO (99,519)
- State House District 33, CO (94,061)
- State House District 49, CO (83,740)
- State House District 11, CO (80,189)
- State House District 61, CO (79,637)
- State House District 56, CO (79,238)
- State House District 57, CO (78,537)
- State House District 34, CO (72,738)
Top 10 Neighboring State Legislative District Upper Chamber (by Population) Neighboring State Legislative District Upper Chamber on the Map
- State Senate District 23, CO (188,398)
- State Senate District 25, CO (181,050)
- State Senate District 4, CO (180,522)
- State Senate District 24, CO (156,797)
- State Senate District 15, CO (155,929)
- State Senate District 8, CO (148,629)
- State Senate District 17, CO (141,285)
- State Senate District 16, CO (136,132)
- State Senate District 31, CO (130,902)
- State Senate District 5, CO (128,103)
Top 10 Neighboring Census Tract (by Population) Neighboring Census Tract on the Map
- Census Tract 128, Boulder County, CO (10,822)
- Census Tract 90.02, Adams County, CO (9,203)
- Census Tract 4.03, Eagle County, CO (8,247)
- Census Tract 21.03, Weld County, CO (8,009)
- Census Tract 85.50, Adams County, CO (7,987)
- Census Tract 85.24, Adams County, CO (7,814)
- Census Tract 1, Pitkin County, CO (7,681)
- Census Tract 85.33, Adams County, CO (7,650)
- Census Tract 85.29, Adams County, CO (7,446)
- Census Tract 1, Summit County, CO (7,406)
Top 10 Neighboring 5-Digit ZIP Code Tabulation Area (by Population) Neighboring 5-Digit ZIP Code Tabulation Area on the Map
- 80229, CO (49,598)
- 80504, CO (46,876)
- 80020, CO (46,871)
- 80233, CO (45,386)
- 80022, CO (42,699)
- 80501, CO (39,521)
- 80221, CO (37,779)
- 80003, CO (35,384)
- 80031, CO (33,932)
- 80601, CO (33,833)
Data
Demographic, Population, Households, and Housing Units
** Data sources from census 2010 **
Show Data on Map
Download Full List as CSV
Download Quick Sheet as CSV
| Subject | This Area | Colorado | National |
|---|---|---|---|
| POPULATION | |||
| Total Population Map | 733,805 | 5,029,196 | 308,745,538 |
| POPULATION, HISPANIC OR LATINO ORIGIN | |||
| Not Hispanic or Latino Map | 584,577 | 3,990,509 | 258,267,944 |
| Hispanic or Latino Map | 149,228 | 1,038,687 | 50,477,594 |
| POPULATION, RACE | |||
| White alone Map | 614,172 | 4,089,202 | 223,553,265 |
| Black or African American alone Map | 8,546 | 201,737 | 38,929,319 |
| American Indian and Alaska Native alone Map | 5,978 | 56,010 | 2,932,248 |
| Asian alone Map | 28,764 | 139,028 | 14,674,252 |
| Native Hawaiian and Other Pacific Islander alone Map | 621 | 6,623 | 540,013 |
| Some Other Race alone Map | 53,716 | 364,140 | 19,107,368 |
| Two or More Races Map | 22,008 | 172,456 | 9,009,073 |
| POPULATION, SEX | |||
| Male Map | 371,012 | 2,520,662 | 151,781,326 |
| Female Map | 362,793 | 2,508,534 | 156,964,212 |
| POPULATION, AGE (18 YEARS) | |||
| 18 years and over Map | 556,979 | 3,803,587 | 234,564,071 |
| Under 18 years | 176,826 | 1,225,609 | 74,181,467 |
| POPULATION, AGE | |||
| Under 5 years | 50,254 | 343,960 | 20,201,362 |
| 5 to 9 years | 51,215 | 348,603 | 20,348,657 |
| 10 to 14 years | 47,711 | 332,654 | 20,677,194 |
| 15 to 17 years | 27,646 | 200,392 | 12,954,254 |
| 18 and 19 years | 22,714 | 139,083 | 9,086,089 |
| 20 years | 12,256 | 69,437 | 4,519,129 |
| 21 years | 11,926 | 67,385 | 4,354,294 |
| 22 to 24 years | 34,059 | 211,793 | 12,712,576 |
| 25 to 29 years | 56,865 | 372,459 | 21,101,849 |
| 30 to 34 years | 55,212 | 353,819 | 19,962,099 |
| 35 to 39 years | 55,750 | 353,605 | 20,179,642 |
| 40 to 44 years | 54,002 | 346,039 | 20,890,964 |
| 45 to 49 years | 54,761 | 371,635 | 22,708,591 |
| 50 to 54 years | 53,501 | 371,063 | 22,298,125 |
| 55 to 59 years | 46,118 | 328,364 | 19,664,805 |
| 60 and 61 years | 15,928 | 115,654 | 7,113,727 |
| 62 to 64 years | 20,737 | 153,626 | 9,704,197 |
| 65 and 66 years | 10,172 | 80,153 | 5,319,902 |
| 67 to 69 years | 12,934 | 102,339 | 7,115,361 |
| 70 to 74 years | 15,137 | 127,468 | 9,278,166 |
| 75 to 79 years | 10,805 | 96,908 | 7,317,795 |
| 80 to 84 years | 7,512 | 73,144 | 5,743,327 |
| 85 years and over | 6,590 | 69,613 | 5,493,433 |
| MEDIAN AGE BY SEX | |||
| Both sexes Map | 34.70 | 36.10 | 37.20 |
| Male Map | 34.00 | 35.10 | 35.80 |
| Female Map | 35.50 | 37.10 | 38.50 |
| HOUSEHOLDS | |||
| Total Households Map | 282,514 | 1,972,868 | 116,716,292 |
| HOUSEHOLDS, HOUSEHOLD TYPE | |||
| Family households: Map | 180,551 | 1,261,527 | 77,538,296 |
| Husband-wife family Map | 141,850 | 971,397 | 56,510,377 |
| Other family: Map | 38,701 | 290,130 | 21,027,919 |
| Male householder, no wife present Map | 13,160 | 91,299 | 5,777,570 |
| Female householder, no husband present Map | 25,541 | 198,831 | 15,250,349 |
| Nonfamily households: Map | 101,963 | 711,341 | 39,177,996 |
| Householder living alone Map | 71,328 | 550,794 | 31,204,909 |
| Householder not living alone Map | 30,635 | 160,547 | 7,973,087 |
| HOUSEHOLDS, HISPANIC OR LATINO ORIGIN OF HOUSEHOLDER | |||
| Not Hispanic or Latino householder: Map | 241,670 | 1,678,258 | 103,254,926 |
| Hispanic or Latino householder: Map | 40,844 | 294,610 | 13,461,366 |
| HOUSEHOLDS, RACE OF HOUSEHOLDER | |||
| Householder who is White alone | 248,434 | 1,684,494 | 89,754,352 |
| Householder who is Black or African American alone | 3,144 | 75,670 | 14,129,983 |
| Householder who is American Indian and Alaska Native alone | 2,044 | 19,236 | 939,707 |
| Householder who is Asian alone | 8,831 | 44,716 | 4,632,164 |
| Householder who is Native Hawaiian and Other Pacific Islander alone | 205 | 2,017 | 143,932 |
| Householder who is Some Other Race alone | 14,490 | 103,385 | 4,916,427 |
| Householder who is Two or More Races | 5,366 | 43,350 | 2,199,727 |
| HOUSEHOLDS, HOUSEHOLD TYPE BY HOUSEHOLD SIZE | |||
| Family households: Map | 180,551 | 1,261,527 | 77,538,296 |
| 2-person household Map | 73,537 | 543,679 | 31,882,616 |
| 3-person household Map | 41,564 | 280,645 | 17,765,829 |
| 4-person household Map | 38,555 | 249,205 | 15,214,075 |
| 5-person household Map | 16,523 | 113,933 | 7,411,997 |
| 6-person household Map | 6,198 | 44,983 | 3,026,278 |
| 7-or-more-person household Map | 4,174 | 29,082 | 2,237,501 |
| Nonfamily households: Map | 101,963 | 711,341 | 39,177,996 |
| 1-person household Map | 71,328 | 550,794 | 31,204,909 |
| 2-person household Map | 22,712 | 129,348 | 6,360,012 |
| 3-person household Map | 4,938 | 20,551 | 992,156 |
| 4-person household Map | 2,124 | 7,487 | 411,171 |
| 5-person household Map | 563 | 2,061 | 126,634 |
| 6-person household Map | 194 | 667 | 48,421 |
| 7-or-more-person household Map | 104 | 433 | 34,693 |
| HOUSING UNITS | |||
| Total Housing Units Map | 338,728 | 2,212,898 | 131,704,730 |
| HOUSING UNITS, OCCUPANCY STATUS | |||
| Occupied Map | 282,514 | 1,972,868 | 116,716,292 |
| Vacant Map | 56,214 | 240,030 | 14,988,438 |
| HOUSING UNITS, OCCUPIED, TENURE | |||
| Owned with a mortgage or a loan Map | 152,120 | 1,004,977 | 52,979,430 |
| Owned free and clear Map | 36,939 | 288,123 | 23,006,644 |
| Renter occupied Map | 93,455 | 679,768 | 40,730,218 |
| HOUSING UNITS, VACANT, VACANCY STATUS | |||
| For rent Map | 8,192 | 57,644 | 4,137,567 |
| Rented, not occupied Map | 553 | 3,058 | 206,825 |
| For sale only Map | 4,572 | 32,673 | 1,896,796 |
| Sold, not occupied Map | 757 | 5,418 | 421,032 |
| For seasonal, recreational, or occasional use Map | 38,071 | 101,965 | 4,649,298 |
| For migrant workers Map | 66 | 524 | 24,161 |
| Other vacant Map | 4,003 | 38,748 | 3,652,759 |
| HOUSING UNITS, OCCUPIED, AVERAGE HOUSEHOLD SIZE BY TENURE | |||
| Total: Map | 2.56 | 2.49 | 2.58 |
| Owner occupied Map | 2.65 | 2.57 | 2.65 |
| Renter occupied Map | 2.38 | 2.34 | 2.44 |
| HOUSING UNITS, OCCUPIED, TENURE BY RACE OF HOUSEHOLDER | |||
| Owner occupied: Map | 189,059 | 1,293,100 | 75,986,074 |
| Householder who is White alone Map | 171,363 | 1,159,190 | 63,446,275 |
| Householder who is Black or African American alone Map | 1,408 | 30,955 | 6,261,464 |
| Householder who is American Indian and Alaska Native alone Map | 1,048 | 9,056 | 509,588 |
| Householder who is Asian alone Map | 5,581 | 26,860 | 2,688,861 |
| Householder who is Native Hawaiian and Other Pacific Islander alone Map | 106 | 974 | 61,911 |
| Householder who is Some Other Race alone Map | 6,767 | 45,118 | 1,975,817 |
| Householder who is Two or More Races Map | 2,786 | 20,947 | 1,042,158 |
| Renter occupied: Map | 93,455 | 679,768 | 40,730,218 |
| Householder who is White alone Map | 77,071 | 525,304 | 26,308,077 |
| Householder who is Black or African American alone Map | 1,736 | 44,715 | 7,868,519 |
| Householder who is American Indian and Alaska Native alone Map | 996 | 10,180 | 430,119 |
| Householder who is Asian alone Map | 3,250 | 17,856 | 1,943,303 |
| Householder who is Native Hawaiian and Other Pacific Islander alone Map | 99 | 1,043 | 82,021 |
| Householder who is Some Other Race alone Map | 7,723 | 58,267 | 2,940,610 |
| Householder who is Two or More Races Map | 2,580 | 22,403 | 1,157,569 |
| HOUSING UNITS, OCCUPIED, TENURE BY HISPANIC OR LATINO ORIGIN OF HOUSEHOLDER | |||
| Owner occupied: Map | 189,059 | 1,293,100 | 75,986,074 |
| Not Hispanic or Latino householder Map | 167,815 | 1,147,073 | 69,617,625 |
| Hispanic or Latino householder Map | 21,244 | 146,027 | 6,368,449 |
| Renter occupied: Map | 93,455 | 679,768 | 40,730,218 |
| Not Hispanic or Latino householder Map | 73,855 | 531,185 | 33,637,301 |
| Hispanic or Latino householder Map | 19,600 | 148,583 | 7,092,917 |
| HOUSING UNITS, OCCUPIED, TENURE BY HOUSEHOLD SIZE | |||
| Owner occupied: Map | 189,059 | 1,293,100 | 75,986,074 |
| 1-person household Map | 38,832 | 290,450 | 16,453,569 |
| 2-person household Map | 69,086 | 489,896 | 27,618,605 |
| 3-person household Map | 31,984 | 203,538 | 12,517,563 |
| 4-person household Map | 30,176 | 184,668 | 10,998,793 |
| 5-person household Map | 11,885 | 77,305 | 5,057,765 |
| 6-person household Map | 4,290 | 29,150 | 1,965,796 |
| 7-or-more-person household Map | 2,806 | 18,093 | 1,373,983 |
| Renter occupied: Map | 93,455 | 679,768 | 40,730,218 |
| 1-person household Map | 32,496 | 260,344 | 14,751,340 |
| 2-person household Map | 27,163 | 183,131 | 10,624,023 |
| 3-person household Map | 14,518 | 97,658 | 6,240,422 |
| 4-person household Map | 10,503 | 72,024 | 4,626,453 |
| 5-person household Map | 5,201 | 38,689 | 2,480,866 |
| 6-person household Map | 2,102 | 16,500 | 1,108,903 |
| 7-or-more-person household Map | 1,472 | 11,422 | 898,211 |
Loading...